ADPAY Monthly
Reservoir intelligence with 35+ years of production history
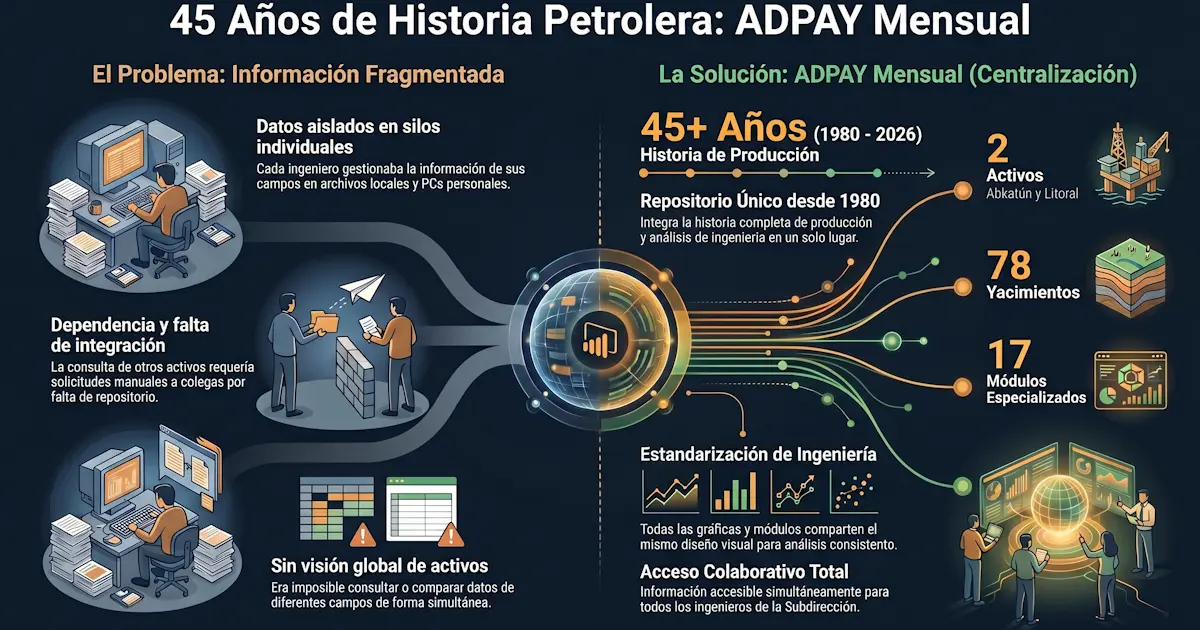
Context
Every engineer in the Subdirección kept the production history of their own fields on their personal computer. If you needed data from another field — a pressure curve, a cumulative volume, a reservoir's history — you had to track down that engineer, ask for the file, and wait. There was no shared repository, and consulting data from the other asset meant going through someone else every single time.
ADPAY Monthly solved that at the root: it centralized 45 years of production history — from 1980 to the present — in a single system accessible to all Subdirección engineers simultaneously. All fields, both assets, all charts with the same design and criteria. No more requesting files, no more waiting, no more conflicting versions of the same data. It also integrated specialized reservoir engineering analyses — drive mechanisms, channeling diagnosis (Chan plot), pressure-production — directly in Power BI, discretized by asset, field, reservoir, well, and geological era.
RMSO operational history — Marina Suroeste Region (1980–2022)
Annual averages · Marina Suroeste Region · Source: ADPAY Monthly · Internal PEMEX data
Reservoir modules in action
Real ADPAY Monthly screenshots — reservoir engineering analyses integrated directly in Power BI.
Monthly Production — Full history
Módulo 01 / 179 historical charts for the Subdirección from 1980: Qo vs Np, Qg vs Gp, GOR and Fw, Qo with Fw, combined fluids, Qo/well vs wells, Fw vs wells, GOR vs wells.
Compare CY — Well history
Módulo 03 / 17Historical curve comparison per well: Np, Qo vs time, Qo vs Np, GOR by date, Wp, Pws. Drill-down by geological era and reservoir type.
Pressure-Production
Módulo 06 / 179 long-term historical charts per field: Qo/Qw/Qg, Np, Pws/RExE/Pb, GOR, Fw, Qo/well, water vs Np, normalized TBM.
Energy vs Extraction
Módulo 09 / 17Animated scatter of Energy Pws/Pi vs Extraction Factor Np/ROA per field, with timeline from 1980 to present.
Chan — Channeling Diagnosis
Módulo 14 / 17RAA vs RAA* log-log diagnostic per well. Identifies water breakthrough mechanism: coning, mechanical communication, or channeling.
Drive Mechanisms
Módulo 16 / 17Energy Pws/Pi vs Recovery Factor Np/N curves with 5 drive mechanisms per reservoir: hydraulic drive, solution gas, gas cap, rock-fluid expansion, gravity drainage.
Solution: ADPAY Monthly
Specialized modules
Pressure-Production, Asset History, Field History, Energy vs Extraction, Volumes, Extraction, Reserves, 80/20, Chan Plot, Drive Mechanisms and more.
Years of history
Complete production history from 1980 to present, with reservoir engineering analyses embedded directly in Power BI.
Assets analyzed
Abkatún Pol Chuc, Litoral de Tabasco, Cantarell and Ku-Maloob-Zaap — all of PEMEX's Marine Region in one system.