ADPAY Daily
Real-time operational monitoring of ~300 wells across the Marine Subdirección
Context
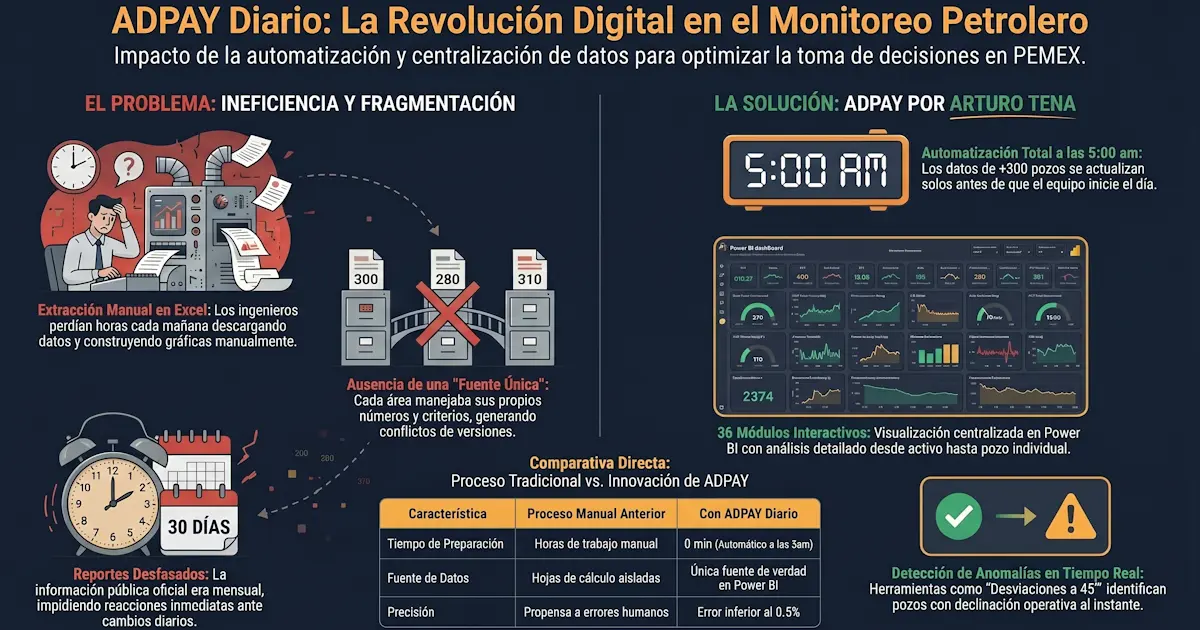
Before ADPAY, each engineer manually downloaded operational data every morning and built their own Excel charts for presentations. There was no single source of truth: each area had its own numbers, its own visualizations, and its own criteria for interpreting the day's production status.
ADPAY Daily centralized the 5:00 am production cutoff into 36 interactive Power BI modules — simultaneously accessible by all Subdirección engineers, with drill-down to well, reservoir, field, and asset level. PEMEX published this same information monthly; ADPAY had it available every day.
Daily operational production — Marina Suroeste Subdirección (2018–2023)
Barrels per day (MBD) · Illustrative data consistent with BDI PEMEX public monthly averages · Error < 0.5%
💡 The daily variability of Litoral de Tabasco reflects the operational complexity of its platforms — exactly the type of signals ADPAY enabled engineers to detect and analyze in real time.
Modules in action
Real ADPAY Daily screenshots — data at the April 24, 2023 cutoff.
Daily Production
Módulo 01 / 36Real-time KPI cards: Oil, Gas and Water per asset vs prior day, with trend sparklines.
Asset Qo Today
Módulo 05 / 36Oil production treemap, geographic well map and delta waterfall vs prior day by asset.
Daily Production Trends
Módulo 12 / 369 simultaneous charts: Qo, Qg, Qw, GOR, Fw, active wells, Qo/well, combined fluids — cascading filters by asset, field, reservoir and well.
45° Deviations
Módulo 16 / 36Scatter of Qo today vs Qo yesterday per individual well. Above diagonal = improving; below = declining. Instantly identifies operational outliers.
Operating Conditions
Módulo 17 / 365 charts per well: pressure (Ptp/Pbaj/T), production vs gauge, Qo/Qw vs gauge, fluid analysis (°API, Fw, salinity) and historical Pbaj/Ptp.
Subcritical Flow
Módulo 24 / 36Pbaj/Ptp diagnostic per well with time animation, percentage bars per well and today vs yesterday Ptp-Pbaj scatter.